Car Wash Vacuum Systems

Case Study

Car Wash Mods — Teaching Industrial Vacuums When to Breathe

How smarter controls, better UX, and disciplined engineering turned runaway power bills into measurable ROI.

This story didn't start with a whiteboard.


It started with $8,000 electric bills.


At car wash sites, the numbers were impossible to ignore. Month after month, the power bills stayed high — regardless of how busy the vacuums actually were.


That's when the real question surfaced:

"Why are our biggest motors running at full speed… when most vacuum bays are empty?"

THE REAL PROBLEM

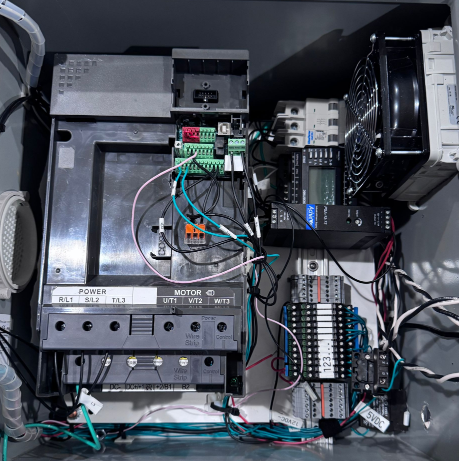
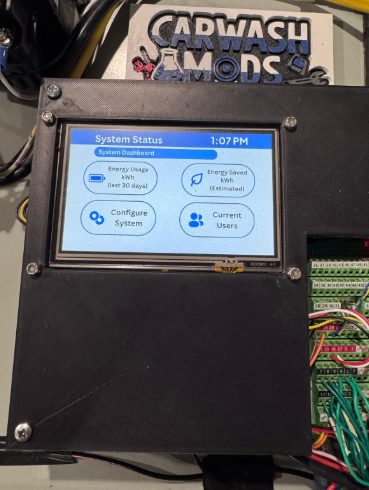
The largest motors on the property were running 100% of the time, from open to close.


That might make sense if:


  • Every vacuum bay was always in use
  •  

  • Airflow demand was constant
  •  


But in reality:


  • Usage was random
  •  

  • Only a few vacuums were active at any given time
  •  

  • The system had no idea when customers were actually using it
  •  


Energy wasn't being used.

It was being wasted.

THE EARLY PROTOTYPE (BEFORE US)

Before we entered the picture, Jon (owner of this idea) had already done something important:


They noticed the problem and started experimenting.


An internal engineer began prototyping a simple idea:


A vacuum is "in use" only when the nozzle is removed from its holster.


It sounds simple — until you try to make it reliable in the real world.


Wind.

Customers bumping hoses.

Nozzles not seated correctly.

Vibration.

Weather.


It took nearly two years of iteration just to make the concept dependable.

"By the time Jon approached us, they had a working mechanical concept — but not a system."

WHERE DESIGN 4 IT STEPPED IN

Our role wasn't to reinvent the idea.


It was to turn it into a product.


That meant:


  • Adding an intelligent control layer
  •  

  • Designing a usable on-device GUI
  •  

  • Writing the control logic that tied airflow, gates, and motor speed together
  •  

  • Creating a real BOM that could be built, installed, and supported
  •  

  • Making the system understandable to operators — not just engineers
  •  


In short:

We took a prototype and made it deployable.

"We took a prototype and made it deployable."

Control Panel Interface

THE GUI & UX TRANSFORMATION

The system needed visibility.


So we added a screen-based interface that allowed operators to:


  • See real-time system status
  • Monitor active vacuum bays
  • Run baseline and diagnostic tests
  • Configure thresholds and behaviors without guesswork


No cryptic LEDs.

No blind tuning.


The UX was designed for industrial environments — clear, readable, and fast to understand.


This wasn't a tablet slapped on a box. It was a purpose-built control experience.

CONTROL LOGIC THAT MATCHED PHYSICS

The real breakthrough came when airflow control and motor control were treated as one system.


We integrated:


  • Vacuum holster state detection
  •  

  • Blast gate actuation per vacuum pole
  •  

  • Dynamic turbine speed control based on real


    demand
  •  


Instead of relying on rubber seals across dozens of idle poles, only active poles opened.


The physics did the rest.


Less airflow → less turbine load → less energy required to spin.

Industrial Turbine

THE BLAST GATE MOMENT

The first installation ran on a 20 HP Sonny's turbine.


With just the vacuum idle system:


27% energy reduction was achieved in the first months


Good — but not game-changing.


Then came the next idea:

"What if every vacuum pole had its own blast gate?"

EVERYTHING CHANGED

Once implemented, energy reduction jumped from 27% to 75%.


Why?


  • Unintended air leaks disappeared
  •  

  • The turbine no longer worked against open lines
  •  

  • Speed scaled precisely with the number of active users
  •  


One user → ~65% speed

Two users → ~75% speed

Three users → ~85% speed


Airflow stayed strong.

Energy usage collapsed.

Industrial Equipment
Car Wash Business

REAL INSTALLATIONS. REAL DATA.

By 2026, installations began


Hypothetically, measured using installed power meters:


Site 1: 75% average power reduction

Site 2: 55% average power reduction


And critically:


  • No loss of suction at the nozzle
  •  

  • Verified using anemometer testing
  •  

  • Performance stayed consistent even with imperfect customer behavior
  •  


This wasn't lab data.


This was real-world abuse included.

THE BUSINESS MATH

With an installed cost of approximately $20,000:


Site 1 projected ROI: 3.52 years

Site 2 projected ROI: 2.94 years


And that includes:


  • Incorrectly placed nozzles
  • Occasional full-speed maintenance runs
  • Normal adjustment and tuning realities


In other words — conservative numbers.

WHAT THIS PROJECT REALLY DID

Gorilla Express didn't just reduce power bills.


They:


  • Turned airflow into a controlled resource
  •  

  • Gave operators visibility and control
  •  

  • Created a scalable system that adapts to usage automatically
  •  

  • Proved that smart controls beat brute force every time
  •  


And most importantly:


They stopped paying for energy they weren't using.

THE TAKEAWAY

This project reinforced a core DESIGN 4 IT belief:


Real efficiency isn't about better motors.

It's about knowing when not to use them.


From GUI and UX

to control programming

to BOM and deployable hardware


This wasn't optimization.


It was intelligence added to infrastructure.

"Ready to turn raw equipment into a thinking system?"